Last modified: 2026-05-07 13:08:52
< 2026-05-06 2026-05-11 >Historical total return dataset
I think possibly pause on getting a FTSE 100 historical total return dataset.
There is https://github.com/fja05680/sp500 which tells us historical constituents for S&P 500.
And https://eodhd.com/ claims to have historical daily prices for major US companies since 1985.
https://eodhd.com/financial-academy/financial-faq/historical-stock-prices-for-delisted-companies implies they have data for companies that were delisted.
And I think the £20/mo subscription can access all this stuff. So the plan is to pay £20, scrape everything I can, and then unsubscribe.
The daily request limit is 100k calls per user. I think I just need end-of-day prices for every company that has ever been listed in the US? That should be less than 100k calls. And then can see what else I can scrape.
Getting a list of delisted tickers is:
[https://eodhd.com/api/exchange-symbol-list/{EXCHANGE_CODE}?api_token={YOUR_API_KEY}&delisted=1](https://eodhd.com/api/exchange-symbol-list/{EXCHANGE_CODE}?api_token={YOUR_API_KEY}&delisted=1)
And by extrapolation I guess you drop "delisted" to get current tickers.
And then end-of-day prices are:
[https://eodhd.com/api/eod/AAAB.US?api_token={YOUR_API_KEY}](https://eodhd.com/api/eod/AAAB.US?api_token={YOUR_API_KEY})
What EXCHANGE_CODEs are there?
OK I am making some progress on this. One issue is that tickers are reused so if you ask for historical data for a particular ticker you get the new company and not the old one.
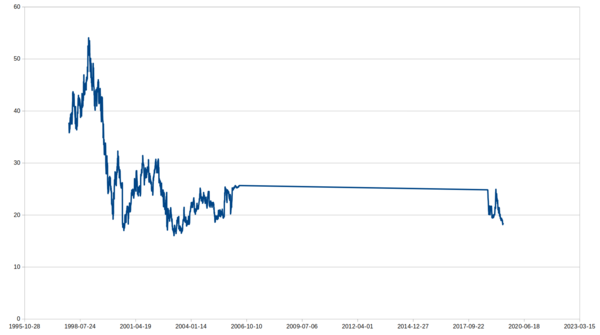
One example is "ABS.US" which apparently referred to "Albertson's", which was in the index from 1996 to 2006, but EODHD only has data for "ABS.US" from end of 1997.
And to make it worse, I don't even think the historical company is Albertson's, here's the price data from EODHD:
The big gap suggests the ticker was reused. I have contacted support about rectifying the problem.
But for now maybe I proceed with the full universe that I do have, for both UK and US.
OK well I had to do quite a lot of massaging to exclude obviously-crazy data, but:
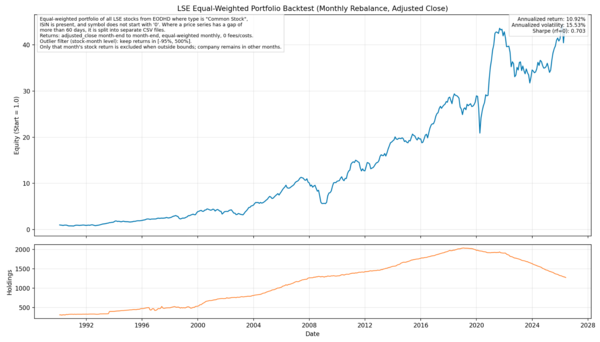
Annualised Sharpe ratio of 0.7 sounds maybe slightly too high, not sure. I can overlay this on a plot of FTSE All-share total return to see how well it approximates it.
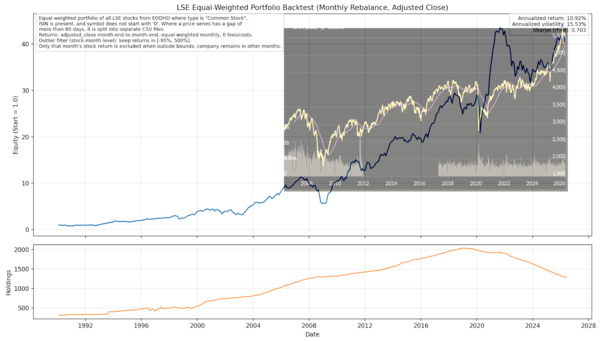
The chart overlaid in black is the FTSE All-share index, and yeah it is quite different to our equal-weighted version. Apart from the big spike in 2021 on our equal-weighted version, I wonder if this is mainly down to the black chart not including adjustments for dividends?
Well on this dataset: no, low-risk stocks do not outperform:
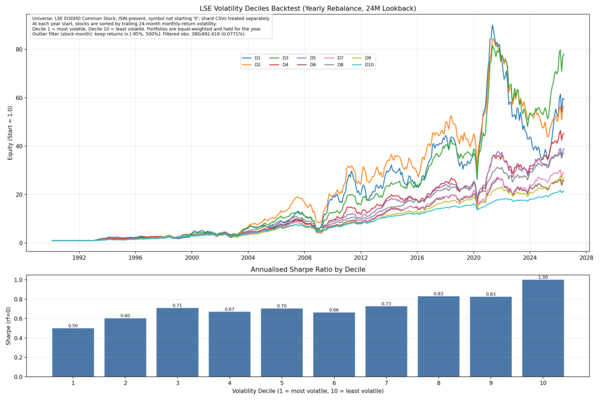
Of course this could simply be down to the bias in the data. If the volatile companies that went bust are more likely to be missing, or the tiny companies that went on to be big are more likely to be present, then we will overstate how well small and volatile stocks perform.
< 2026-05-06 2026-05-11 >