Last modified: 2023-11-04 09:21:29
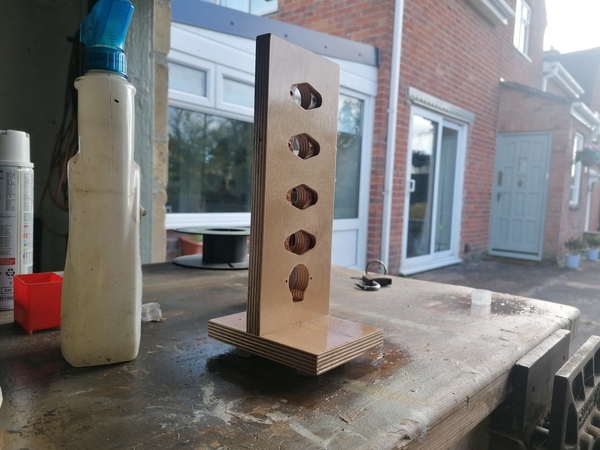
< 2023-11-02 2023-11-04 >I went out and sprayed another coat of varnish:
Looks pretty good, I probably won't do another after this. Also I noticed that in CAD the intention was to have the "large" part of the base at the back, so that the electrical stuff has more room, instead of at the front where it doesn't serve much of a purpose. Oops, never mind.
So now I need to design the cover for the electrics.
I've gone for this:
I can't be bothered cutting out plastic pieces for the windows, so it's all made solid.
My clamp meter has arrived, so let's try and work out how much power this motor is using...
Around the low-voltage side it is reading 213 mA, which I recall is at about 13 volts, = 2.7 W. On the 240v side it is reading 308 mA, which at 240v is 74 W.
But why is the primary drawing more current than the load on the secondary, when the seconday is a lower voltage? Is this transformer really only 4% efficient?
I don't think that can be right, else the transformer would be dissipating 70 watts and would get much hotter than the motor.
The clamp meter seems to give very different readings based on the angle at which I hold it, not very good.
The highest I measured for the secondary was 860mA, and the lowest for the primary was 80mA, which works out to about 10 watts at the motor or 19 watts at the primary. Still seems wrong. I think the issue is that the wires are too close to the transformer, and the field from the transformer is interfering with the clamp meter.
I just noticed that I have a doc in doc/CONST.md with some thoughts on how to optimise constants.
On 20231016 I added a const keyword and did some of it, but there is plenty more to do.
Missing is:
func, asm)const globalsSo let's look at improving constant initialisation of global vars. The idea is that instead of
generating actual code to initialise the value, we just write the value at the place where we
allocate the memory. So:
ld (_foo), 123
...
_foo: .word 0
becomes:
...
_foo: .word 123
0xfe36.After: ends at 0xfe1c (saving 26 words).
Before: lib.o is 9442 words.
So, lol, that was not worth it.
Also, the SCAMP build is totally broken. It always takes at minimum several rounds of make -j to get it
to build. I should fix this.
I also noticed that slangi's eval is:
ld x, 1(sp)
ld x, (x)
jmp x
Which is 14 cycles, but there is no reason we can't have a jmp (x) instruction (indeed, there is
already jmp i8l(x)). So I'll just add a jmp (x) and then it is:
ld x, 1(sp)
jmp (x)
Which is 11 cycles, which saves 3 cycles on every single node evaluation. Is that big? Let's benchmark with a loop that does some simple arithmetic 1000 times.
var x = 0;
var i = 0;
while (i < 1000) {
    x = x + 123;
    i = i + 1;
};
printf("%d\n", [x]);
So not a big difference. Oh, but most of the time here is actually in context-switching, because I was profiling from sh. So actually it's quite
good that it's even noticeable! Let's put the profile-controlling code in the test program instead:
outp(2, 1);
var x = 0;
var i = 0;
while (i < 1000) {
    x = x + 123;
    i = i + 1;
};
printf("%d\n", [x]);
outp(1, 1);
Meh, I'll take it. I profiled this program and the breakdown is:
EvalAssignmentNode: 23.2%EvalAddNode: 18.1%EvalConstNode: 16.0%EvalLtNode: 9.0%eval: 8.7%Some trivial optimisation to EvalAssignmentNode got another ~5% improvement on this benchmark. So maybe
I should go over some of my Advent of Code solutions from last year, profile them in slangi, and try to
make them run faster.
Let's start with day 8 part 1, because it looks to not just be trivial O(n) loops calling library code. https://github.com/jes/aoc2022/blob/master/day8/part1.sl
Oh, not enough memory. Let's try day 14 part 1 instead. Well it runs nice and slow...
Profile top is:
eval_function: 11.8%EvalLogicalOrNode: 7.6%eval: 6.4%EvalSubNode: 5.4%EvalGeNode: 5.3%EvalLocalNode: 5.1%newscope_runtime: 4.8%EvalArrayIndexNode: 4.4%EvalLtNode: 4.3%EvalGlobalNode: 3.8%EvalPostOpNode: 3.0%So let's look at each of those...
I can't see any obvious easy wins in the first few, but:
EvalLocalNode = asm {
    pop x
    inc x
    ld x, (x)
    add x, (_BP)
    ld r0, (x)
    ret
};
This could be...
EvalLocalNode = asm {
    pop x
    ld x, 1(x)
    add x, (_BP)
    ld r0, (x)
    ret
};
So what difference does that make? It will save 2 cycles per call to EvalLocalNode, out of a previous total
of 30, which means EvalLocalNode becomes 7% faster, and it was previously 5.1% of runtime, so runtime
is 0.36% faster, or about 3.6 seconds in this case? I'll take it, but it doesn't really make a dent.
And the same improvement is available in EvalGlobalNode.
Maybe the best thing I can do is rewrite eval_function in assembly language.